Leveraged Loans
With LBOs scarce, leverage in syndicated US loan market sinks to 7-year low
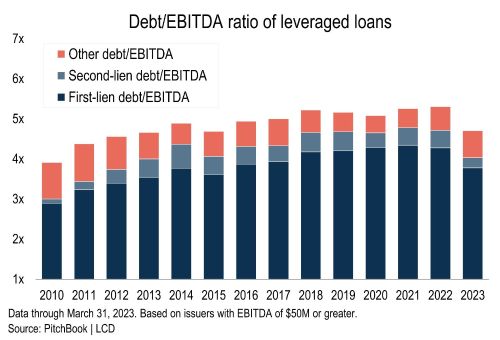
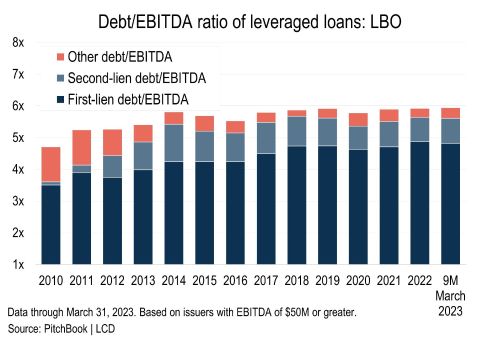
April 28, 2023The debt/EBITDA ratio of new-issue US leveraged loans has fallen below 5x for the first time in seven years as LBOs, a traditional staple of the broadly syndicated market, remain largely absent.
Loans issued during the first quarter of 2023 had an average debt/EBITDA ratio of 4.7x, based on pro forma adjusted EBITDA, according to LCD, matching 2015 as the lowest reading in the last 10 years. Overall leverage ratios reached their 5.3x peak in 2021, as demand for floating-rate debt skyrocketed and M&A activity crushed even pre-Global Financial Crisis levels.
The landscape has changed drastically this year, of course.
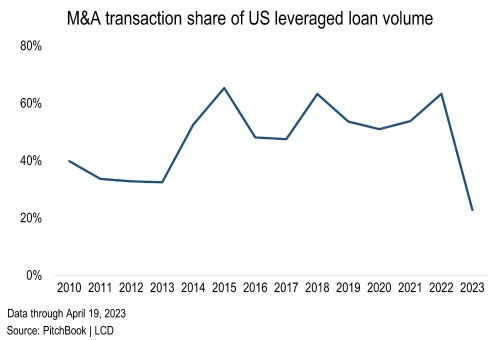
M&A transactions, which typically carry higher leverage multiples, have taken a back seat to refinancings amid macro-economic headwinds and the surging cost of debt. M&A has accounted for just 23% of new-issue institutional volume so far this year, the lowest share on record for any similar period, down from a 49% annual average between 2010 and 2022. LBOs — the most aggressively levered transactions — have represented just 11% of this year’s volume, a 14-year low, down from a 22% post-GFC average and 27% average in the prior five years.
Many of the LBOs that would traditionally have been done in the syndicated loan market have moved to private credit. An LCD estimate, published for the first time in the fourth quarter of 2022, showed how much private credit has grown at the expense of broadly syndicated loans and high-yield bonds.
The data shows that borrowers are increasingly opting to finance deals with directly originated loans, thereby bypassing the need to undertake a syndicated debt facility, which can be more vulnerable to volatility in the financial markets, pricing uncertainty and delays in deal execution.
The trend in leverage in the syndicated loan segment also indicates that risk appetite in the bank loan market remains subdued, despite deals starting to return to this market in the first quarter.
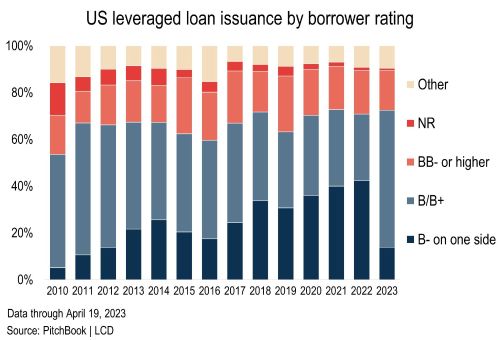
Similarly, the absence of LBOs has resulted in fewer B-minus borrowers in the loan market, contributing to the drop in overall leverage levels. Only 14% of this year’s issuance fell into the B-minus category, the lowest level in over 10 years. In 2021 and 2022 more than 40% of institutional loans came from this bucket.
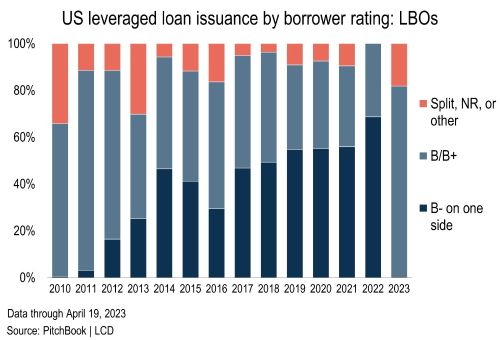
Since 2019, more than half of all buyouts financed in the broadly syndicated loan market have been rated B-minus by at least one ratings agency, with the bulk of the remainder falling into either a B-flat or B+ category. So far this year, private equity firms financed just seven buyouts in the syndicated loan market. None had a B-minus issuer rating.
Given such a shortage of LBOs this year, it is challenging to compile a meaningful sample of leverage ratios for these loans, as LCD’s credit statistics data focuses on the broadly syndicated market. Looking over the last nine months, buyout leverage ratios look very close to 2022 and 2021 levels, at around 5.9x.
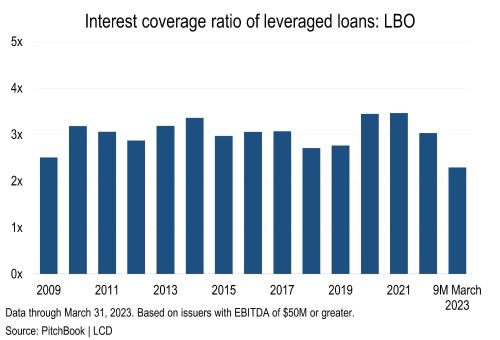
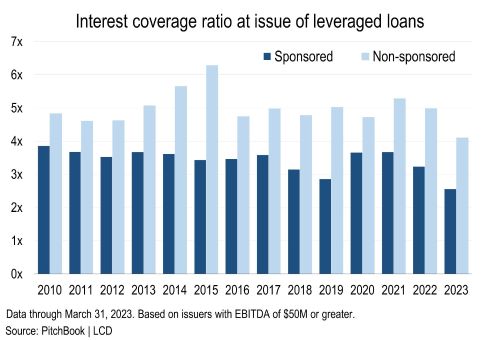
However, interest coverage has declined significantly given the skyrocketing cost of debt. Over the last nine months, the EBITDA/interest ratio was at 2.3x for new-issue LBOs, the tightest level since 2007. It stood at 3x last year and 3.5x in 2021.
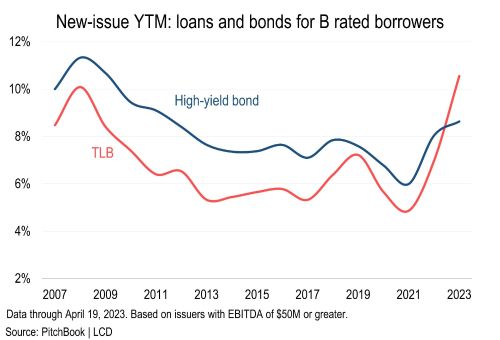
Leveraged loan new-issue yields rose to an all-time high this year as the base rate skyrocketed and spreads widened. The three-month term Sofr crossed over 5% this month, versus 4.6% at the start of the year and less than 1% a year ago. As a result, loans to borrowers in the broad single-B category were yielding 10.55% at issue, the highest level since LCD began tracking this data 23 years ago and more than doubling from 2021 (4.86%). Similarly, the cost of fixed-rate debt rose to a 12-year high, with the average YTM for high-yield bonds at 8.63% in the year to April 19, up from 5.99% in 2021.
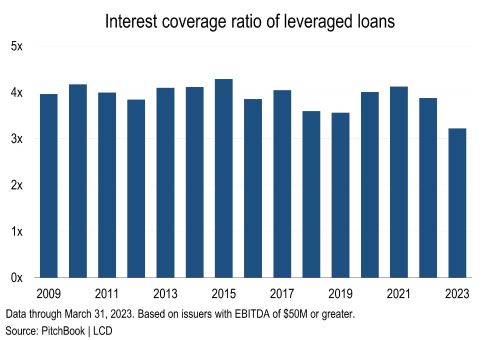
Looking at all new-issue leveraged loans, regardless of purpose, interest coverage ratios declined to 3.2x so far this year, the lowest reading since 2007, down from 3.9x in 2022 and over 4x in 2021 and 2020.
These metrics measure interest coverage at close of each loan. While LCD does not track current financials of outstanding loans for private borrowers, the data for public companies suggests a deterioration in interest coverage. Based on LCD's sample of 141 loan issuers that report their results publicly, interest coverage on outstanding leveraged loans tumbled in the fourth quarter by roughly half a turn, to the lowest levels of the last seven quarters, to 5x on a weighted average basis, or 5.6x on a straight average basis. The sample is skewed toward higher-rated public names — double-Bs account for roughly half of the sample — so this cohort will have less aggressive leverage and coverage metrics, versus a much larger PE-backed universe, which is dominated by single-B rated borrowers. However, the two cohorts generally travel in the same direction, based on new-issue credit statistics tracked by LCD. For reference, over the last 10 years, sponsored borrowers’ interest coverage was 1.7x lower at issuance than non-sponsored deals, on average.
Risk vs. return
Let's consider lender compensation, relative to risk, as measured by spread-per-unit of first-lien leverage (SPL). The first-lien debt-to-EBITDA ratio has declined significantly so far this year, to 3.8x, from 4.3x in 2022, although lenders’ share of overall financing remained relatively unchanged, at 80% of total debt. At the same time, spreads also stepped back slightly on an annual basis, to Sofr+415, from Sofr+427. As a result, lenders received 110 bps per unit of first-lien leverage so far in 2023, an eight-year high, up from 100 bps last year and 88 bps in 2021.
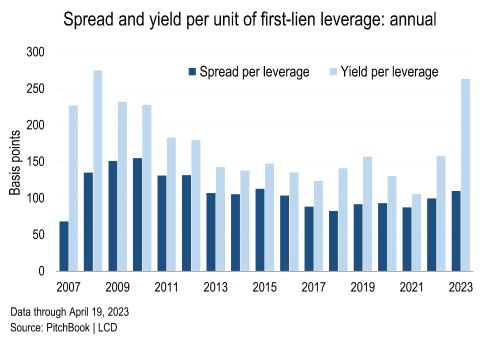
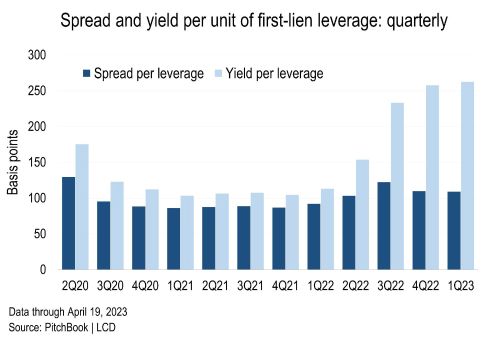
Looking at yield to maturity, which takes into account spread, the original-issue discount on a loan, and the base rate, yield-per-unit of leverage (YPL) has spiked to 263 bps this year, the highest reading since the Global Financial Crisis. This metric stood at 158 bps in 2022 and at just 106 bps in 2021. While spread per unit of leverage (SPL) declined on a quarterly basis, as spreads retreated from 2022 highs, YPL continued to climb due to rising base rates.
Join the more than 1.5 million industry professionals who get our daily newsletter!
Comments:
Thanks for commenting
Our team will review your remarks prior to publishing.
Please check back soon to see them live.