What is a high-yield bond?
A high-yield bond–also known as a junk bond–is a debt security issued by companies or private equity concerns, where the debt has lower than investment grade ratings. It is a major component – along with leveraged loans–of the leveraged finance market.
For a brief explainer on how the market works, check out this video, courtesy LCD and Paddy Hirsch.
Want a bigger picture? Paddy’s got a great video on how leveraged finance works. You know, as in those billion-dollar LBOs you hear about (they often involve junk bonds).
Non-investment grade versus investment grade
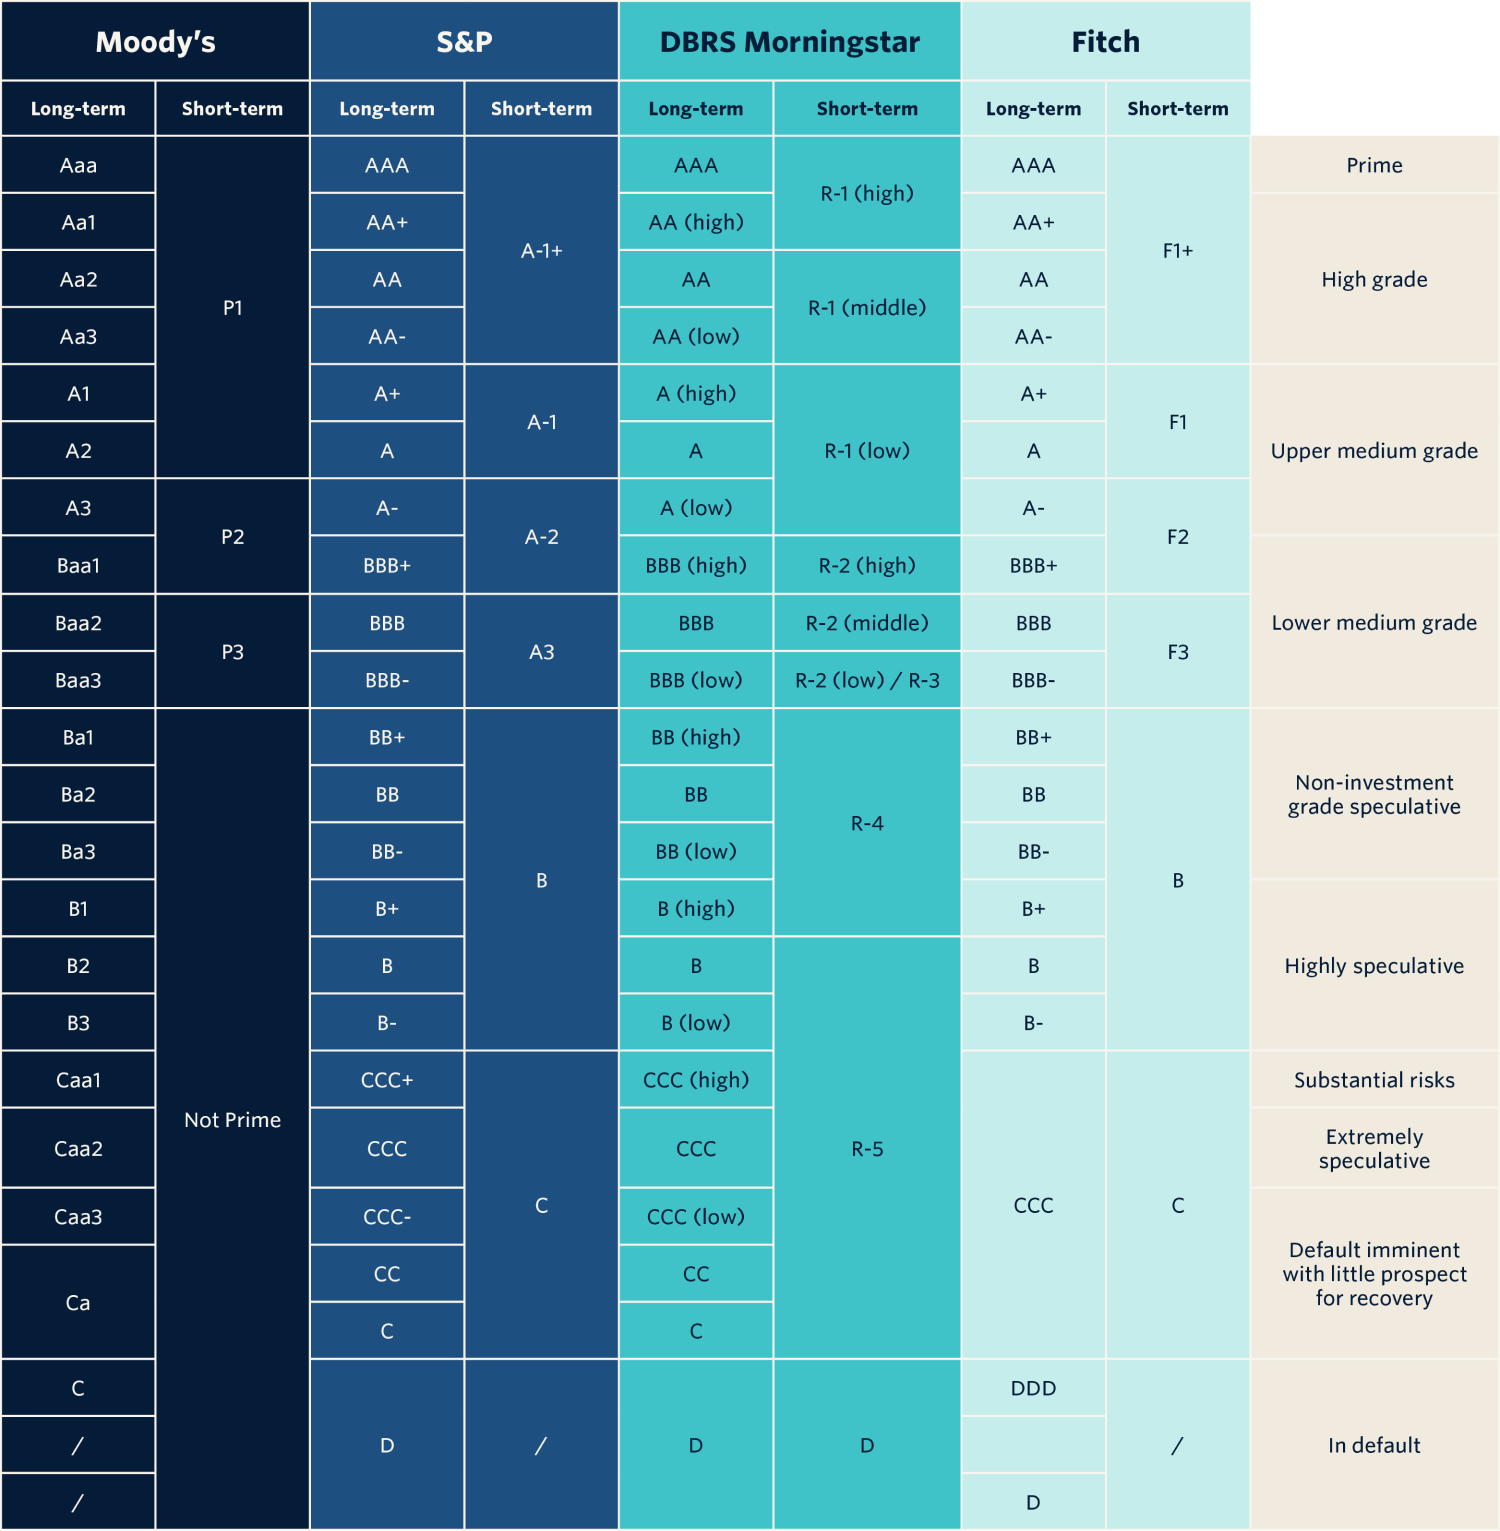
Non-investment grade ratings are those lower than BBB- (or its equivalent), while an investment grade rating (or corporate rating) is BBB- or higher.
A non-investment grade rating is important as it suggests a greater chance of an issuer’s default, wherein the company does not pay the coupon/interest due on a bond or the principal amount due at maturity in a timely manner.
Consequently, non-investment grade debt issuers must pay a higher interest rate–and in some cases they must make investor-friendly structural features to the bond agreement–to compensate for bondholder risk, and to attract the interest of institutional investors.
A ratings breakdown:
Background - Public versus private
Some background is in order. The vast majority of loans are unambiguously private financing arrangements between issuers and lenders. Even for issuers with public equity or debt, and which file with the SEC, the credit agreement becomes public only when it is filed–months after closing, usually–as an exhibit to an annual report (10-K), a quarterly report (10-Q), a current report (8-K), or some other document (proxy statement, securities registration, etc.).
Beyond the credit agreement there is a raft of ongoing correspondence between issuers and lenders that is made under confidentiality agreements, including quarterly or monthly financial disclosures, covenant compliance information, amendment and waiver requests, and financial projections, as well as plans for acquisitions or dispositions. Much of this information may be material to the financial health of the issuer, and may be out of the public domain until the issuer formally issues a press release, or files an 8-K or some other document with the SEC.
What is a junk bond?
“Junk bond,” or “speculative-grade bond” are simply other names for a high-yield bond. These terms helped give the asset class some negative connotation in its more formative years. The asset class has matured into a large, liquid marketplace, however, which now attracts a broad swath of investors and multitudes of issuers.
How big is the high-yield bond market?
After growing rapidly over the past 10-15 years, high yield now comprises roughly 15% of the overall corporate (investment grade) bond market, which itself is estimated at roughly $8.1 trillion, trailing the US Treasury market ($12.7 trillion outstanding) but larger than the municipal bond market ($3.7 trillion outstanding), according to second-quarter 2015 estimates by industry trade group Securities Industry and Financial Markets Association (SIFMA).
Market history
Corporate bonds have been around for centuries, but growth of the non-investment-grade market did not begin until the 1970s. At this time, the market was composed primarily of companies that had been downgraded for various reasons from investment-grade, becoming “fallen angels,” (you can read about those here) and which continued to issue debt securities.
The first real boom in the market was in the 1980s, however, when leveraged buyouts and other mergers appropriated high-yield bonds as a financing mechanism. Probably the most famous example is the $31 billion LBO of RJR Nabisco by private equity sponsor Kohlberg Kravis & Roberts in 1989 (the financing was detailed in the best-selling book Barbarians at the Gate). The financing backing the deal included five high-yield issues that raised $4 billion. While certainly there have been huge deals in market since that transaction, it’s still notable today as the 16th largest high-yield offering on record, according to LCD.
Since then, more companies have found acceptance with a growing pool of investors as the high-yield market developed. High-yield bonds still are used to finance merger and acquisition activity, including LBOs (you’ll note that most of the deals in the table above backing leveraged buyouts), and often back dividend payouts to private equity sponsors, and the market still supports funding capital-intensive projects, such as telecommunications build-out, casino development and energy exploration projects.
These days, though, the market also is a good deal of its own refinancing mechanism, with proceeds often paying off older bonds, bank loans and other debt.
The high-yield market matured through increasing new bond issuance, which reached a peak of $287 billion in 2010, and via additional fallen angels, most notably Ford Motor Company and General Motors in 2005. Indeed, with the automakers’ combined $80 billion of fallen angel corporate bonds downgraded into the asset class, high yield ballooned to roughly $1 trillion in 2006. Just ten years earlier, the asset class was a humble $200 billion, according to SIFMA. And with the ongoing new issuance weighed against maturing bonds and other bond take-outs, the market has held around approximately $1 trillion, according to Bank of America Merrill Lynch. Steady growth of the high-yield bond market saw only a few notable speed bumps. There was the savings and loan scandal in the 1980s, the correction after the “tech wreck” in 2001, and of course most recently the subprime mortgage meltdown, credit crunch and financial crisis of 2008. Issuance that year was just $69 billion, the lowest in seven years, according to LCD.
High-yield bond issuers
Companies issuing high-yield bonds are usually seeking money for growth (via M&A, perhaps), for working capital and for other cash-flow purposes, or to refinance existing loans, bonds, or other debt.
Companies with outstanding high-yield debt cover the spectrum of industry sectors and categories. There are industrial manufacturers, media firms, energy explorers, homebuilders and even finance companies, to name a few. The one thing in common–indeed the only thing–is a high debt load, relative to earnings and cash flow (and, thus, the non-investment grade ratings). It’s how the issuers got there that breaks the high-yield universe into categories.
The most frequent types of issuers are detailed below. Additionally, other capital-intensive businesses, such as oil prospecting, find investors in the high-yield bond market, as do cyclical businesses, such as chemical producers.
Fallen angels
The first high-yield companies were the “fallen angels,” or entities that used to carry higher ratings, before falling on hard times. These companies might find liquidity in the high-yield market and improve their balance sheets over time, for an eventual upgrade. Some fallen angels often hover around the high-grade/high-yield border, and frequently carry investment grade ratings by one agency and non-investment grade by another. These often are referred to as “crossover,” “split-rated,” or “five-B” bonds. Other issuers might never improve, and head further down the scale, toward deep distressed and potentially default and/or file for bankruptcy.
There were 26 fallen angels globally in 2016’s first half (through June 8). Leading the pack: Financial institutions, mining/commodities companies, and oil & gas concerns. Of the 26 fallen angels, half are from the US.
Start-ups
Frequently, high-yield issuers are start-up companies that need seed capital. They do not have an operational history or balance sheet strong enough to achieve investment grade ratings. Investors weigh heavily on the business plan and pro forma financial prospects to evaluate prospects with these scenarios. Telecommunications network builds and casino construction projects are examples.
Bankruptcy exit
Bankruptcy exit financing can be found in the high-yield market. Publisher of the National Enquirer, American Media, and auto-parts company, Visteon, are recent examples. Both were well received in market during the first half of 2011 and secured exit financing despite past investor losses with the credits.
LBOs
Leveraged buyouts (LBOs) typically use high-yield bonds as a financing mechanism, and sometimes the private investors will use additional bond placements to fund special dividend payouts. This part of the market saw explosive growth in 2005-06, amid a buyout boom not seen since the late 1980s, then again in the 2005-2007 bubble, only to fizzle in the ensuing crisis. Indeed, LBO-related high-yield issuance peaked at $51 million 2007 only to slump to zero in 2009. It returned in 2010, though certainly not to the pre-Lehman heights
High yield bond investors
Investors in high-yield bonds primarily are asset-management institutions seeking to earn higher rates of return than their investment-grade corporate, government and cash-market counterparts. Other investors in high yield include hedge funds, individuals and arrangers of instruments that pool debt securities. Some common investor groups:
-
Insurance companies
Insurance companies invest their own capital and account for around 29% of the investment community. These accounts cover insurance and annuity products.
-
Mutual funds
Mutual funds represent approximately 13% of the investor pool. These institutional investors might be managing traditional, long-only high-yield funds or portfolios that invest only in high-yield securities, but via both long- and short-positions. Further, there are corporate bond funds that invest in both high-yield and high-grade bonds, and general fixed income funds that hold positions across corporate, government and municipal securities segments.
-
Pension funds
Pension funds account for roughly 28% of the high-yield investor universe. They seek greater return on the retirement money entrusted to them than what’s being paid out to retirees. Pension funds are trustees for the retirement money and act under prudent investment rules, which vary state to state.
-
CDOs/Collateralized Debt Obligations
Collateralized Debt Obligations, or CDOs, once comprised as much as 16% of the market. These packaged debt instruments invest in a pool of securities for a lower risk of default. Thus, the pool of bonds, or basket of securities, receives higher credit ratings. There are bond-only instruments known as CBOs, loan-only instruments known as CLOs and packages of both, which are generically described as CDOs. This segment of the investor base grew rapidly in the first half of the 2000 decade, only to wither in the credit crisis. As of 2012, it is unclear how much of the high-yield market is held in CDOs.
-
ETFs/Exchange-Traded Funds
Exchange-Traded Funds, or ETFs, have a miniscule-yet growing-presence in the high-yield market.
Recent additions to relatively plain-vanilla, broad-indexed ETFs (HYG, JNK, and PHB) include actively managed (not indexed) fund HYLD, short-tenor funds (SJNK, HYS), international funds (IHYG and IJNK), non-US high-yield (HYXU), and even a contrarian, short-seller fund (appropriately, SJB, suggestive of a mandate to “short junk bonds”).
-
Other specialty investors
The balance of the high-yield investment community comprises hedge funds and other specialized investors, both domestically and internationally, as well as individual investors, commercial banks, and savings institutions. Hedge funds had a growing presence in the high-yield market over the 2003-05 bull market and remain entrenched
High yield bond issuance
High-yield bond issuance usually entails three steps:
- Investment bankers draft an offering proposal, or prospectus, and negotiate conditions with potential investors
- The securities are allocated/syndicated to bondholders once terms of the offering are finalized
- The bonds become available for purchase and sale in the aftermarket, or secondary, via broker/dealers
Often, the process is more fluid and less exact than with other fixed-income securities because the issuer has a “story” to tell to market the deal, because issuers and underwriters are subject to more questions, given the higher risks, and because deal structure can be reworked numerous times.
Secondary markets
Once bond terms are finalized and accounts receive allocations from the underwriters, the issue becomes available for trading in the aftermarket.
Secondary trading of high-yield bonds is a well-established and active marketplace. Broker-dealers often traffic in the “grey market” before the paper is “freed to trade,” and in some cases there are grey market indications even before terms of the offering are finalized. For example, a trader could indicate buying interest at issue price plus, or minus, valuation, such as a market quote “IP+1/4” or “IP-3/8.”
A move toward more transparent pricing comes on the heels of the full implementation of Trade Reporting and Compliance Engine (TRACE), the Financial Industry Regulatory Authority’s (FINRA’s) bond trade reporting system. Broker-dealers now report all trades of corporate bonds, including all registered high-yield issues, mostly within five minutes of execution, although the mandatory deadline stated is 15 minutes.
FINRA was formed by a consolidation of the enforcement arm of the New York Stock Exchange, NYSE Regulation, and the National Association of Securities Dealers (NASD). The merger was approved by the United States Securities and Exchange Commission (SEC) on July 26, 2007. It is a private corporation that acts as a self-regulatory organization (SRO). Though sometimes mistaken for a government agency, it is a non-governmental organization that performs financial regulation of member brokerage firms and exchange markets, according to Wikipedia citations.
The high-yield trading published by TRACE has its roots in a NASD system, the Fixed Income Pricing System, which provided hourly dissemination of prices and trading volumes of 50 liquid high-yield credits, and was known as the “FIPS 50.”
With trade reporting widespread, companies such as MarketAxess Holdings and TradeWeb Markets, owned by Thomson Financial, in turn provide almost real-time high-yield bond prices on their platforms.
Most bond traders have opposed increased market transparency, which erodes margins as bonds change hands. Investors generally say they want to trade the paper only at the levels where the most recent executions took place.
Regulators have long since said increased investor knowledge through a tool such as TRACE can only be a positive, arguing that retail investors should have as much information as institutional investors. As then SEC-chairman Arthur Levitt once famously delivered in New York in 1998, “The sad truth is that investors in the corporate bond market do not enjoy the same access to information as a car buyer or a homebuyer or, dare I say, a fruit buyer. And that’s unacceptable. Guesswork can never be a substitute for readily available price data.”
The prospectus
Before awarding a mandate, an issuer might solicit bids from arrangers. The banks will outline their syndication strategy and qualifications, as well as their view as to where the offering will price.
The offering memorandum (prospectus or red herring) is drawn up by the bankers ahead of, or amid, an issuer mandate.
The document typically will include an executive summary, investment considerations, an industry overview and a financial model. The actual bond terms have not been finalized, but often pro forma coupon rates are described to help financial modeling. The syndicate desk likely will try to obtain feedback from potential investors regarding appetite for the deal. Once this intelligence has been gathered the agent will market the deal to potential investors.
Because most bond offerings are sold privately under Rule 144A, this will be a confidential offering made only to qualified banks and accredited investors. Publicly available deals will file their prospectus with the SEC via form 424B2.
Here are two high-profile red herrings:
The prospectus will contain an executive summary that includes a description of the issuer, an overview of the transaction and rationale, sources and uses, and key financials. Risk factors will be detailed, though often they are boilerplate, including such lines as “indebtedness could have a material adverse effect on our financials” and “future strategies may not be successful.” Considerations about income taxes also might be discussed.
The list of terms and conditions are detailed in a preliminary term sheet describing the pricing, structure, collateral, covenants and other terms of the credit (covenants usually are negotiated in detail after the arranger receives investor feedback).
Commitments by the underwriters will be described. In addition to the amounts each syndicate desk intends to offer accounts, fees received by underwriters from the issuer might be detailed, ranging anywhere from 1% per $1,000 face bond to 3.25% (and sometimes higher), depending on the issuer, sector and market conditions.
The industry overview will be a description of the company’s industry and competitive position, relative to its industry peers. The financial model will be a detailed model of the issuer’s historical, pro forma, and projected financials (sometimes, also, management’s high, low and base case for the issuer). For some institutional investors, which buy high-yield and other public securities, the financial model might be stripped of projections and other non-public data.
Most new deal marketing efforts are kicked off internally via a “teach-in” meeting, where bankers pitch the deal to sales staff, describing the terms of the offering and what purpose it serves. Roadshows follow, where company management provides its vision for the transaction, as well as a business update. Well known issuers often only conduct an investor call with a management speech and investor Q&A. These “drive-by” deals can be completed in a matter of hours. And, of course, the internet roadshow has grown momentum in recent years, with online presentations and investor Q&A.
Syndication
There are three primary types of syndications:
- underwritten deal
- a bought deal
- a rate backstop deal
Less common are niche placements, similar to loan market “club deals,” which are negotiated with just a handful of accounts.
Backstop deal
In a backstop deal the underwriter agrees to purchase the deal at a maximum interest rate for a brief, but well-defined, period of time. This method is similar to a bought-deal, but the timeframe typically is longer, generally up to one week. Both seasoned issuers and unfamiliar credits may utilize this type of underwriting.
Underwritten deal
These transactions are marketed on a “best-efforts” basis. The financial institution underwriting the deal has no legal obligation to the issuer regarding completion of the transaction. This is the most common placement method. Issuers range across all industries. First-time issuers without a proven cash flow record are especially common in underwritten transactions.
Bought deal
A bought deal is fully purchased by the underwriter at an undisclosed rate before marketing, and therefore is subject to market risk. This method removes execution risk to issuing companies, which are most commonly well-known and seasoned issuers. Timing is typically a day or less, which helps remove some market risk. Underwriters use this method to compete among themselves for business, but if they are too aggressive, and are unable to fully subscribe the deal, they are forced to absorb the difference, which they may later try to sell in the aftermarket. This is easy, of course, if market conditions–or the credit’s fundamentals–improve. If not, underwriters might have to take a loss on the paper or hold more than intended.
High yield bond structure
There are a variety of bond structures across the landscape of high yield, but two characteristics are constant:
- Coupon, or the rate of interest that the entity pays the bondholder annually
- Maturity, or when the full principal amount of the bond issue is due to bondholders and indicative of interest payment dates
These two characteristics define the value of each bond, and are used to name the individual security, such as “GM’s 7% notes due 2012,” or even more colloquially on trading floors, “GM 7’s of 12.” Other characteristics include whether, when, and at what price, a bond is callable by the issuer, conditions on a put by the bondholder, covenants related to financial performance and disclosure, and even equity warrants.
Coupon
Coupons, or interest rate, typically are fixed for the term of debt issue and pay twice annually. The average coupon for non-investment grade companies have been in the low 8% area in recent years, but double digits are by no means an exception.
Zero-coupon bonds
Some high-yield bond issues pay no coupon at all. These deals are often called “zero-coupon bonds,” “zeros,” or “zips,” and are sold at a steep discount to face value by companies that might not have the cash flow to pay interest for a number of years. Here, investor return comes in the form of capital appreciation, rather than from interest payments.
Zeros were popular with Internet start-ups and wireless build-out projects in the late 1990s. In 1998 for example, zero-coupon issuance was $16 billion, or roughly 12% of total supply. In 2011, by contrast, there were just three such deals in market, raising $1 billion, or just 0.4% of total supply, and none since, according to LCD.
Floating rate notes
Certain deals are more attractive with a floating-rate coupon. These deals, referred to as “floaters” or “FRNs” most often pay interest quarterly, and at a spread priced to the LIBOR rate.
This type of coupon is popular amid an environment of rising interest rates, such as 2004 and 2005. During these years, floating rate issuance increased to 8% and 12% of all new issuance, from merely 1% of supply in 2003. In contrast, during the low-interest-rate environment of 2010-11, there were essentially no such issuance, at just three individual deals, as LIBOR wallowed in a 0.25-0.5% context, according to LCD.
PIKs/PIK toggle
Another option is for a coupon to pay “in-kind,” or with additional bonds rather than cash. These deals, known as “PIK” notes, give the issuer breathing room for cash outlay, just as with zero-coupon bonds. PIKs allow a company to borrow more money–leverage up–without immediate concerns about cash flow.
Thus, as with zero-coupon paper, PIKs are viewed as more highly speculative debt securities. Essentially, the company through in-kind payment is creating more debt in a situation where it doesn’t have the capital to service the debt–quite the paradox.
An innovation during the cresting wave of LBO issuance in 2006 was the introduction of the PIK-toggle structure. In this case, the toggle feature gives the issuer an option to pay cash, or in kind at a higher rate, or in some cases a predefined combination of both types of payment. The issuer is often required to notify investors six months prior to “flipping the switch.”
Retailer Neiman Marcus was the first to test the waters with a PIK-toggle deal in late 2005. A flood followed, reaching a high-water mark in 2007. For the next few years, understandably, PIK toggle issuance was spotty, as was the new-issue market, as issuers frequently found themselves in debt-restructuring mode. PIK-toggle activity picked up in 2011 and 2012 amid low interest rates and a glut of investor case.
PIK-toggle note issuance hit roughly $12 billion in 2013–the highest level since the peak of the credit crisis in 2008–but it accounted for just 4% of total supply, versus 14% in 2008. Most issues backed dividends, though there were a few refinancing efforts. Only one backed an LBO (the 2.0 buyout of Neiman Marcus).
While one view is that a disregard of credit risk amid the reach for yield may be sowing the seeds for the next default cycle, the revival of PIK-toggle is marked by lower leverage, issuance by performing credits, and enhanced features such as shorter tenors and special call options or equity-clawback provisions that might flag a near-term IPO.
Moreover, “contingent toggling” has been worked into deals, with leverage and coverage tests limiting issuer ability to pay in kind. The tenor of recent deals is also shorter, at five years on average, often with a one-year non-call period. The intention: These transactions effectively are short-dated instruments, and would most likely be the first in line to be refinanced
Maturity
High-yield bonds by and large are arranged to mature within seven to 10 years. But, again, there are exceptions. More highly speculative companies might set a high coupon to attract buyers, but shorter tenors to allow for quicker refinancing. Likewise, higher-quality high-yield issuers might lock in a low rate on paper with 12-year maturity if market conditions present such an opportunity.
Examples in 2012 include airplane-parts company B/E Aerospace, which placed 5% notes with 10-year tenor, and Omega Healthcare, which placed 5.875% notes due in 12 years.
Call protection
Call protection limits the ability of the issuer to call the paper for redemption. Typically, this is half of the term of the bonds. For example, 10-year paper will carry five years of call protection, and eight-year bonds cannot be called for four years. None of this is set in stone, however, and often these terms are negotiated amid the underwriting process. Thus, the market sometimes sees seven-year (non-call 3) paper or eight-year (non-call 5) bonds. Floating-rate paper typically is callable after one or two years.
Call premiums
Call premiums come into effect once the period of call protection ends. Usually, the premium on the first call date is par plus 50% of the coupon, declining ratably thereafter each year.
An example: For 9% notes due in 10 years and carrying five years of call protection, the bonds are callable at 104.5% of par upon the fifth year outstanding, then at 103, 101.5 and par in the following years, representing a par-plus-50% coupon, 33%, 17% and par.
A recent innovation by underwriters has been to shorten the call, but balance that issuer-friendly revision by increasing the first-call premium. Typically, it’s at par plus 75% of the coupon, or in the case of the 9% notes, it would be at 106.75% of par.
However, in the latest bull-market cycle that’s enduring in the first half of 2015, arrangers have effectively been able to place short-call paper without the higher first call premium, i.e., eight-year (non-call 3) at the old standard, issuer-friendly first call premium of par plus 50% coupon. This aggressive issuance began peppering the market in 2010-2011 and has gained steam. During the first six months of 2015, for example, there were 39 deals arranged that way (including on five-year, nc2; seven-year, nc3; and eight-year, nc3) for $25.3 billion of supply, versus 55 in all of 2014 for $33 billion of supply and just 27 in 2013 for $14.1 billion in supply.
There have been several instances of investor push-back to the issuer-friendly structure. For example, it was revised out of VistaJet and Cliffs Natural Resources deals in early 2015, and five others in 2014. However, in contrast, super-hot deals were in some cases able to rework this structure into deals, such as Riverbed Technology and Valeant Pharmaceuticals in the first quarter of 2015, according to LCD.
Bullet notes
Bullet structure is the colloquial phrase for full-term call protection. Also described as non-call-life, this characteristic draws buying interest due to lower refinancing risk. However, bullet notes command lower relative yields, for the same reason.
Make-whole
Make-whole call premiums are standard in the investment-grade universe and prevalent in high-yield. This feature allows an issuer to entirely avoid the call structure issue by defining a premium to market value that will be offered to bondholders to retire the debt early. It’s a call, in a sense, but at a relatively exorbitant price. The lump sum payment plan is composed of the following: the earliest call price and the net present value of all coupons that would have been paid through the first call date, which is determined by a pricing formula utilizing a yield equal to a reference security (typically a US Treasury note due near the call date), plus the make-whole premium (typically 50 bps). An example is IKON Office Solutions which offered to buy back its 7.75% notes due 2015 amid a takeover by investment-grade suitor Ricoh. The T+50 make-whole calculated to a price of roughly $1,142 per bond, or essentially 14% more than face value.
Put provisions
Put provisions are the opposite of calls. These features allow bondholders to accelerate repayment at a defined price due to certain events. The most common example is the change-of-control put, usually at 101% of par. In this case, when a specific percentage of the company is purchased by a third party, there is a change in the majority of the board of directors, or other merger or sale of the company occurs, the bonds must be retired by the issuer. This of course would apply to the example of IKON/Ricoh above, however there was no incentive to put paper at 101 because valuation had surged on the takeover news, to a 107 context. The put provision was out of the money. In another example, services firm WCA Waste offered bondholders a special payment to waive the change-of-control. Management wanted to keep the 7.5% notes in place amid a takeover by Macquarie and defend against investor puts if the bond price were to fall below the 101 put price, such as in a broad market slump.
Equity clawbacks
Equity clawbacks allow the issuer to refinance a certain amount of the outstanding bonds with proceeds from an equity offering, whether initial or follow-on offerings. A typical clawback would be for up to 35% of the outstanding bond issue for three years at a level equal to par, plus the coupon. Some clawbacks have come at 15%, others as high as 40%, and in rare cases the timeframe is not just three years. An example for the most typical variety: Company A raises money via an IPO and exercises a clawback for a portion of its 10% bonds at a repurchase price of 110% of par. This is an optional redemption for the issuer and, while the investor has no say or obligation, the repayment premium is tough to disregard.
Warrants
Equity warrants often are attached to the most highly speculative bond issues. In this case, each bond carries a defined number of warrants to purchase equity in the company at a later date. Usually, an issue carries warrants for ownership in 2-5% of the company, but 15-20%, while not the norm, is not unheard of for speculative start-ups.
Escrow accounts
Escrow accounts are created to cover a defined number of interest payments. This feature is popular with build-out transactions, such as the construction of a casino. Escrow accounts typically range from 18 months (three interest payments) to 36 months (six coupons).
Special calls
Special calls have been innovated in recent years, including change-of-control calls provisions and mandatory prepayment. In the case of the former, which have popped up in energy-sector deals during 2011, the premium is 110% of par for a defined period of time. Mandatory prepayments have been defined most often as 103% of par for 10% of the issue each year for a defined period of time. Lyondell Chemical was the first issuer to use the feature in November 2010. The special feature is mandatory for holders, which were notified by mail. As such, investors relinquished their pro rata share as per the company’s notice of redemption.
It is important to note that none of these features is set in stone. Terms of each can be negotiated amid the underwriting process, whether to the benefit of the issuer or investors, depending on the credit, market conditions and investor preferences. A really hot bond offering might see call protection shortened by one year, which benefits the company, or a tough deal could see the first call increased from par+50% coupon to par+coupon, to encourage buying interest. A struggling new issue from a start-up might be forced to tack on equity warrants to sweeten the deal, or add an escrow account to cover the first year’s payments. Investors have argued away special calls and pushed back maturity or call protection. It’s all a moving target, as often times are covenants.
Covenants
High-yield bond issues are generally unsecured obligations of the issuing entity, and covenants are looser than on bank loans, providing the issuer more operating flexibility and enabling the company to avoid the need for compliance certification on a quarterly basis.
The indenture includes the description of covenants. Typical covenants would entail limitations on:
- incurrence of additional debt
- payments
- dividends and payments affecting subsidiaries
- liens
- sale and leaseback transactions
- asset sales mergers or consolidation
Many times, covenants will be reworked during the marketing process to assuage investors. Sometimes ratios and timeframes are revised, and other times entire covenants are added or deleted. The high-yield indenture generally is viewed as “tighter” than that on investment-grade bonds, but looser than on bank loan indentures. Marketing of an accelerated placement from a well-known and seasoned issuer sometimes will carry little or no covenants, and is referred to colloquially as having an investment-grade covenant package.
Bond math
Bond math includes yield to maturity, yield to call, yield to worst, current yield, duration, and accrued interest. See the following sections for details.
Yield to maturity
After a long period in decline following the crash of 2008-09 (by 2014 market players were saying junk bonds should no longer be called “high yield”) the market began to turn, thanks to volatility in Europe and worries regarding the end of quantitative easing in the US (and about rising rates generally). Indeed, by the end of 2015’s fourth quarter–amid a virtual rout in junk–yields were nearing 10%. Things can change quickly in the volatile high-yield market, however. As investor sentiment brightened and oil prices began to rebound, yields dipped noticeably heading into 2016’s second quarter.
Yield to call
Yield to call is the yield on a bond assuming the bond is redeemed by the issuer at the first call date. Yield to call differs from yield to maturity in that yield to call uses a bond’s call date as the final maturity date (most often, the first call date). Conservative investors calculate both a bond’s yield to call and yield to maturity, selecting the lower of the two as a measure of potential return. Like yield to maturity, yield to call calculates a potential return: it assumes that interest income on a particular bond is reinvested at its yield to call rate; that the bond is held to the call date; and that the bond is called.
Yield-to-worst
Yield-to-worst is the lowest yield generated, given the stated calls prior to maturity.
Current yield
Current yield describes the yield on a bond based on the coupon rate and the current market price of the bond (not on its face or par value). Current yield is calculated by dividing the annual interest earned on a bond by its current market price. For example, a $1,000 bond selling for $850 and paying an 8% coupon rate (or $80 per year) has a current yield of 9.41% (the quotient of $80 divided by $850). The coupon rate in this example is 8% (80/1,000).
Duration
Duration is a measure of bond or bond fund’s price sensitivity to changes in interest rates. Duration is defined as the weighted average term to maturity of a security’s cash flows, where the weights are the present value of each cash flow as a percentage to the security’s price. The greater a bond or fund’s duration, the greater its price volatility in response to changes in interest rates. Duration provides an estimate of a bond’s percentage price change for a 1% change in interest rates. For example, the price of a bond with a duration of 2 would be expected to move 2% for every 1% move in interest rates.
Accrued interest
When there are bond trades that settle in between coupon payment dates, the buyer owes the seller interest starting from–and including–the last coupon payment date, up until–but not including–the trade’s settlement date (typically t+3 for corporate bond transactions and t+1 for treasuries).
There are different day-count conventions used in the calculation of accrued interest.
- For corporates, the “30/360” day-count convention is generally used, which assumes 30 days in every month
- For Treasuries, the “actual days” day-count convention is generally used, which factors the exact number of days in each month
Example: To calculate the accrued interest on a corporate bond, the formula would be
Accrued Interest = day count (using the 30/360 convention) x coupon rate x par value
- Par Value: $100,000
- Coupon Rate: 6.50%
- Payment Dates: Jan/Jul 15 (JJ15)
- Trade Date: Monday, April 21st
- Settle Date: Thursday, April 24th
- Day Count = 16 (Jan) + 30 (Feb) + 30 (Mar) + 23 (Apr) = 99
- Accrued Interest = (99/360) x .065 x 100,000 = $1,787.50
Registration
High-yield bond offerings are not typically registered with the SEC. Instead, deals most often come to market under the exception of Rule 144A, with rights for future registration once required paperwork and an SEC review is completed. A small percentage of deals comes to market as “144A-for-life,” meaning without registration rights. In both cases, the issuer is not required to make public disclosures while issuing under the rule.
Either way, the rule 144A exception essentially modifies the SEC’s requirement for investors to hold privately placed securities for at least two years. Instead, “qualified institutional buyers” or “QIBs”–defined under Rule 144A as purchasers that are financially sophisticated and legally recognized by securities regulators to need less protection from sellers than most members of the public–can buy and sell these securities sans-registration.
The 144A paper is often viewed as less-liquid, or harder to trade, in the secondary market given the smaller investor base. And with 144A-for-life paper, it often commands higher premiums at pricing. However, it is a growing segment amid the rise in hedge funds and growing issuer count. Indeed, 144A-for-life issuance in 2011 comprised 15.5% of total supply, nearly triple that of 2006, when it was 5.2% of supply, according to LCD.
Deals that carry registration rights most often will be exchanged for an identical series of registered paper once the time and effort of SEC registration follows through, typically three months from issuance. This private-to-public debt exchange is not a material event for bond valuation, but registration in effect enhances the liquidity of the paper, given it is available to more investors.
Registration with the SEC takes many months, so frequent issuers will make a shelf filing in advance of any market activity. Shelf filings can cover any type of security, or be debt-only, but in both cases the issuer may issue securities only up to the size of the shelf filing. Shelf filings are rated in advance of any transaction.
In July 2005, the SEC put in place “automatic registration” shelf filings. This filing is a relaxed registration process that applies to well-known, seasoned issuers (WKSIs), and covers debt securities, common stock, preferred stock and warrants, among other various instruments. A WKSI is a company that has filed all annual, quarterly and current reports in a timely manner, and either has a greater than $700 million market capitalization or has issued $1 billion in registered debt offerings over the past three years.
High-yield bond derivatives
Credit default swap
Traditionally, accounts bought and sold bonds in the cash market through assignments and participations. Aside from that, there was little synthetic activity outside over-the-counter total rate of return swaps. By 2003, however, the market for synthetically trading bond contracts was budding. Credit default swaps (CDS) are standard derivatives that have the bond as a reference instrument.
It’s basically an insurance contract. The seller is paid a spread in exchange for agreeing to buy at par, or a pre-negotiated price, a bond if that bond defaults. CDS enables participants to synthetically buy a high-yield issue by going short the CDS or sell the paper by going long the CDS. Theoretically, then, a bondholder can hedge a position either directly (by buying CDS protection on that specific name) or indirectly (by buying protection on a comparable name or basket of names).
Moreover, the CDS market provides another way for investors to short a bond. To do so, the investor would buy protection on a bond that it doesn’t hold. If the security subsequently defaults, the buyer of protection should be able to purchase the bond in the secondary market at a discount and then deliver it at par to the counterparty from which it bought the CDS contract. For instance, say an account buys five-year protection for a given bond, for which it pays 10% a year. Then two years later the bond goes into default and the market price falls to 80% of par. The buyer of the protection can then buy the paper at 80 and deliver to the counterpart at 100, a 20-point pickup.
Or instead of physical delivery, some buyers of protection may prefer cash settlement in which the difference between the current market price and the delivery price is determined by polling dealers or using a third-party pricing service. Cash settlement could also be employed if there’s not enough paper to physically settle all CDS contracts on a particular security.
CDX
CDX indices are indices based on CDS obligations. These “synthetic credit indices” originated in 2001 by J.P. Morgan and Morgan Stanley, which acquired the indices in 2007 after being administrator and calculation agent.
The HY CDX index is an index of 100 CDS obligations that participants can trade. The index provides a straightforward way for participants to take long or short positions on a broad basket of high-yield bonds, as well as hedge their exposure to the market.
The index is an over-the-counter product. The index is reset every six months with participants able to trade each vintage of the index that is still active. The index will be set at an initial spread based on the reference instruments and trade on a price basis.
According to a related loan CDX index primer, “the two events that would trigger a payout from the buyer (protection seller) of the index are bankruptcy or failure to pay a scheduled payment on any debt (after a grace period), for any of the constituents of the index.”